Method
1. Data Acquisition and Pre-Processing
The data for our project comes from Stadt Zurich Open data and OpenStreetMap, in which urban community boundaries, green space (parks and forests) data, and community income level data come from Stadt Zurich Open data the pedestrian road network, and residential housing points come from OpenStreetMap. Additionally, we obtained pedestrian road network data and residential building locations from OpenStreetMap. All datasets were retrieved in appropriate formats, including Shapefile and GeoPackage, and projected in the CH1903+ / LV95 (EPSG:2056) coordinate system for consistency in subsequent spatial analysis.2. Data Pre-Processing
Use QGIS and python to clean the data, project and repair the road, residential point and green space elements, and at the same time, construct the road network map and calculate the point-point shortest path.3. Distance matrix calculation
Using the cleaned and structured data, we generated a comprehensive network distance matrix. Specifically, we calculated the shortest network distance from each residential building centroid (identified by a unique point ID) to the centroid of each green space. This generated matrix served as the foundational dataset for subsequent accessibility analyses.4. Multi-threshold accessibility
We conducted a multi-scale accessibility analysis to determine how easily residents from each community can reach green spaces. Accessibility indices were calculated separately for five specific walking-time thresholds — 5, 10, 15, 20, and 25 minutes. This enabled us to:- Analyze variations in accessibility at multiple spatial scales.
- Understand how quickly accessibility improves as walking thresholds increase.
- Identify critical thresholds where significant disparities between communities emerge.
5. Merging income and accessibility
To explore the relationship between socio-economic status and green space accessibility, we integrated income-level data into our spatial analyses. Specifically, we:- Joined income data (median income values per community) to each corresponding community polygon layer.
- Categorized communities based on income levels (low, middle, high)
- Combined these income categories with the calculated green space accessibility indices, enabling us to directly compare accessibility outcomes across different income groups.
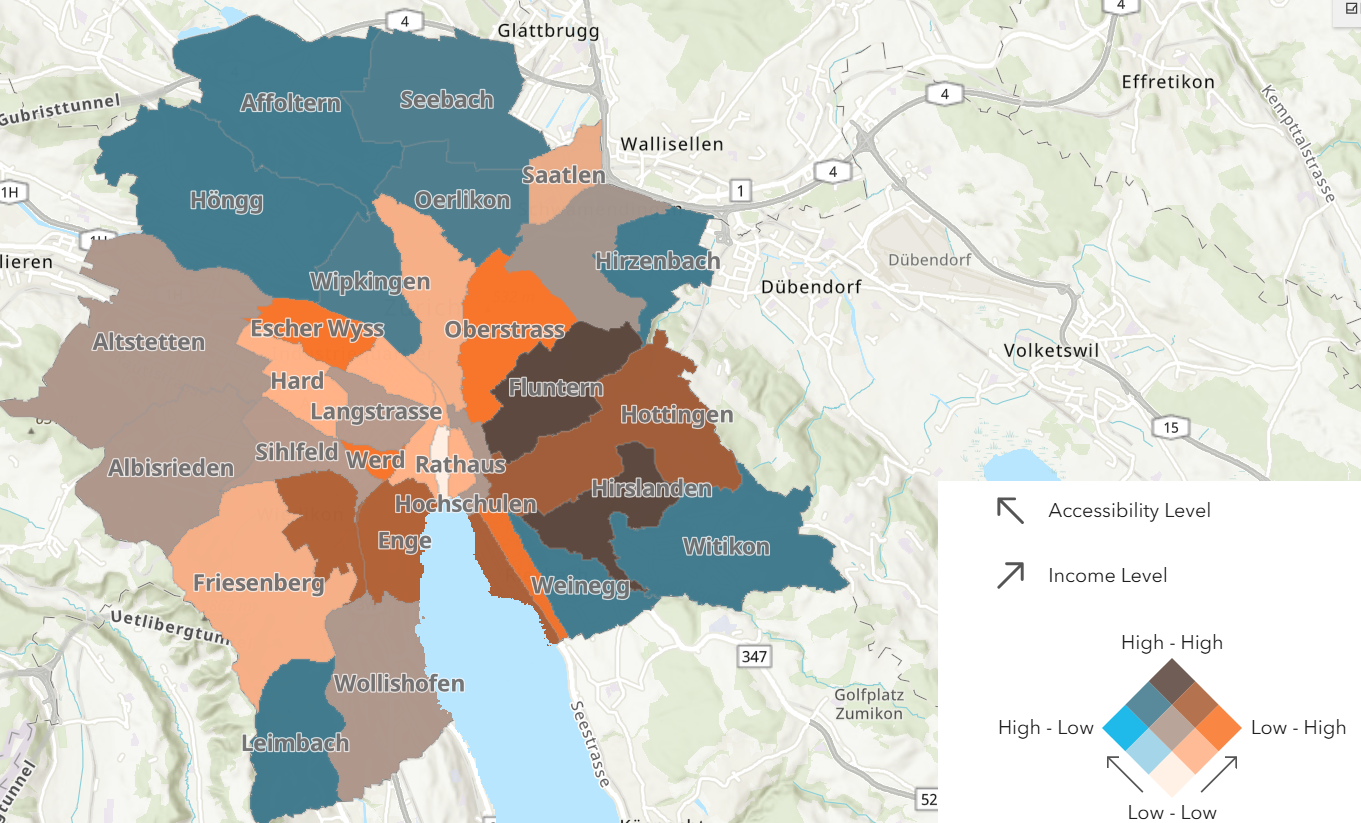
6. Bivariate Thematic Maps
We created detailed bivariate thematic maps to illustrate the interplay between accessibility and income levels:- Classified communities into a 3×3 matrix based on accessibility quartile (low, medium, high) and income quartile (low, medium, high).
- Produced visual maps clearly highlighting areas of varying accessibility-income scenarios.
- Included a clear 2-dimensional legend for intuitive interpretation by urban planners.
1)Generate the network distance matrix from residential point (pid) to each green space centre of gravity (ID).
2) Multi-threshold accessibility Calculate greenfield accessibility index separately for each threshold ‘5/10/15/20/25 minutes’ under each community.
3) Merging income and accessibility Make an attribute connection between the population income table and the community surface and categorise the greenfield accessibility index and income level.
Design
Compound the community facets into 9 categories by simultaneously classifying them 3×3 by accessibility quartile and income quartile, adding a 2D legend.